LWS Current Space Weather Data function OpenGoes( url ) { open( url,"",“toolbar=no,location=no,directories=no,status=no,menubar=no,resizable=y,scrollbars=yes,width=700,height=595”); } function OpenWin( url ) { open( url,"",“toolbar=no,location=yes,directories=no,status=no,menubar=no,resizable=y,scrollbars=yes,width=750,height=595”); }
Living With a Star Current Space Weather Links Return to LWS DE Home
The current weather in space (see the overview and forecasts) starts at the Sun, which is the source of Coronal Mass Ejections and flares, both associated with solar active regions. These produce changes in the solar wind that flows by the Earth and the other planets. The earth’s magnetosphere responds to upstream conditions with changes in the magnetopause, energetic particles in the radiation belts, auroral displays, and currents and changes in the ionosphere and magnetic field. One fairly direct effect of space weather is on radio broadcasts.
What is a good public level page about current space weather?

SpaceWeather.com
Public oriented page giving images and interpretation of current space weather phenomena
What are the current space weather forecasts?
NOAA/SEC Today’s Space Weather
The most recent space weather forecasts from the NOAA/Space Environment Center. Has plots and images from the GOES spacecraft. See also their “meteorologist’s view.”
Have there been any coronal mass ejections recently?


SOHO/LASCO & EIT Real Time Movies
Latest movies from SOHO EUV images and white light coronagraphs. Latest CME dections from “CACTUS” based on SOHO.
Have there been any flares recently?

GOES X-ray Flare Plot
GOES X-ray line plots for the last three days. What it means
SolarSoft Latest Events
Solar images, line plots, and tables to help determine flare locations
What active regions are on the Sun?

Front Side: Active Region Monitor
Tool showing active regions locations superimposed on solar maps made in many wavebands plus other related resources

Back Side: SOHO/MDI Far Side Imaging Page
Maps of the Sun’s far side made using the SOHO helioseismology instrument
What is the orientation of the interplanetary magnetic field?

LMSAL Solar Wind Model
Model movies and plots of the interplanetary magnetic field (IMF) based on extrapolation of the solar magnetic field. What it means.
Also, predictions compared to ACE data

GSE Forecasts
Model plots of the IMF orientation and shock fronts based on conditions at the Solar surface and the HAF solar wind model. Also, predictions compared to ACE data
What are the predicted solar wind conditions at Mercury, Venus, Earth, and Mars?


CASS Forecasts
Space Weather forecasting with Interplanetary Scintillation Data. Includes density and velocity plots and magnetic field maps.
What are the current conditions at the L1 point?

ACE Browse Plots
Line plots of ACE parameters from the last 4 days. What it means
ACE Real Time Solar Wind Page
Access to real time solar wind data for each of the ACE instruments
Where is the magnetopause?

Real Time Magnetopause
Model of Magnetopause boundary based on ACE data
What are the current conditions in the Earth’s magnetosphere?

GOES Satellite Environment Plot
Line plots and bar charts showing proton and electron flux and Hp from GOES spacecraft, and estimated ground-based Kp. What it means
How high are energetic ion and electron fluxes in the radiation belts?

LANL Energetic Particle Plots
“Low energy” proton and electron summary plots from spacecraft in geosynchronous orbit What it means
What is strength of the currents flowing into and out of the ionosphere?

UPOS
Current flow maps based on Iridium satellite data. What it means
Where are the aurora now?

POES
2D plots of the aurora from space extrapolated from POES spacecraft data
Where are the aurora predicted?

OVATION
Predication of auroral oval position based on low altitude particle precipitation data.
How strong is the convection of ionospheric plasma across the polar cap?

SuperDARN
Maps based on high frequency radar data

Real Time AMIE
Real time assimilative mapping of ionospheric ilectrodynamics based on data from ACE and ground based magnetometers
What is the magnetic field at the ground?

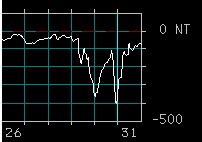
Kiruna Magnetogram
High-latitude magnetic field measurements What it means
Equatorial Dst from WDC-C2 Kyoto
Low-latitude magnetic field measurements What it means
USGS Data International Data
Current and past magnetic field at many stations.
How are radio communications affected?

Ionospheric foF2 Maps
Maps showing the maximum possible broadcast frequency in different locations
Responsible NASA official: Dr. Terry Kucera
Web Curator: Dr. Aaron Roberts
E-mail: aaron.roberts@nasa.gov
Last revised 15 November 2005